Using Prometheus and Grafana to Visualize ISP Packet Loss
Background
Since people started working from home, poor video/voice call connections have become a very annoying problem.
However, it’s hard for people to diagnose what is the root cause. People start blaming their ISPs, and I feel bad for them. In fact, there are a number of reasons that can cause poor video call connections, but if you can tell us with great confidence that my problem is not from your end.
You should probably start monitoring your ISP packet loss.
Prerequisites
- Grafana(You can register a free Grafana Cloud account)
- Prometheus (You can install it on your Raspberry Pi or NAS)
- Open Source Router OS (OpenWRT, ClearOS, Asuswrt-Merlin etc)
Process
Set Up ping_exporter
SSH in to your router > Download ping_exporter
You can check which version you need here.
For example:
wget https://github.com/czerwonk/ping_exporter/releases#:~:text=ping_exporter_0.4.7_linux_arm64.tar.gz
Extract the file:
tar -xf ping_exporter_*.tar.gz ping_exporter
Move to /usr/local/bin:
mv ping_exporter /usr/local/bin
Choose the way you like to get the ISP’s DNS servers on your router.
For example:
cat /etc/resolv.conf
Create a ping_exporter.yaml file under /etc/ping_exporter/:
targets:
  - <Your ISP's DNS servers>

ping:
  interval: 2s
  timeout: 3s
  history-size: 42
  payload-size: 120
Create a ping_exporter.service file under /etc/systemd/system/:
[Unit]
Description=ping_exporter

[Service]
User=root
ExecStart=/usr/local/bin/ping_exporter --config.path /etc/ping_exporter/ping_exporter.yaml
Restart=always

[Install]
WantedBy=multi-user.target
Reload the service files:
sudo systemctl daemon-reload
Start your ping_exporter.service:
sudo systemctl start ping_exporter.service
Check the status of your ping_exporter.service:
sudo systemctl status ping_exporter.service
To enable your ping_exporter.service on every reboot:
sudo systemctl enable ping_exporter.service
Get the results for testing via cURL:
curl http://localhost:9427/metrics
Add a target to Prometheus
In your Prometheus configuration file, add the target in the static_config section :
- targets: ["<Your router's ip/dns address>:9427"]
The reload your Prometheus’ configuration.
Create a Grafana Panel
Add a new Panel in your home network’s dashboard, we are going to use the ping_loss_percent metric.
ping_loss_percent{instance="<Your router's ip/dns address>:9427",target="<Your ISP's DNS servers>"}
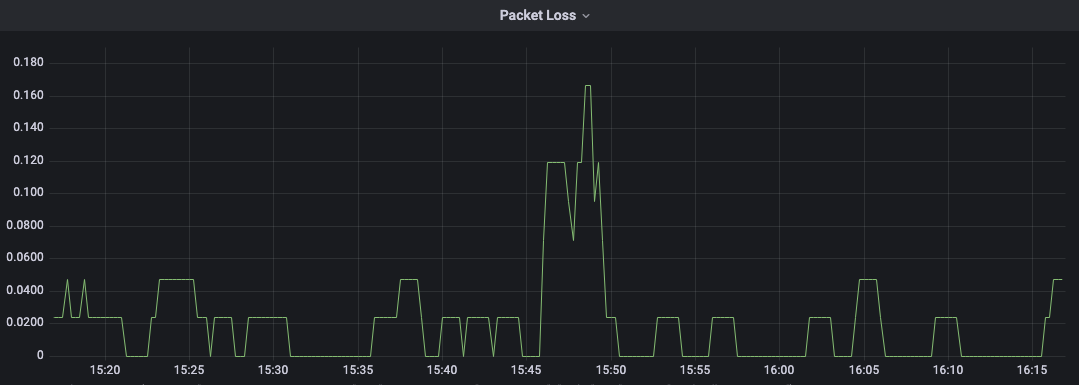
⚠️ Please note for voice and video calls, any packet loss below 0.05 could be considered acceptable.
